This is an old revision of the document!
Debug Mode
Syntax
$connection->debug = boolean|int;
Description
Enabling debug mode makes the driver return copious amounts of debugging information from both ADOdb and the PHP driver itself. Information is displayed on both standard output (STDOUT) and standard error (STDERR) channels.
Usage
The debug option can be enabled and disabled at any time, to debug portions of a program. The earliest it can be set is after the inclusion of the driver, and before the connection.
In the following example, the table name is spelled incorrectly (it should be products). When run without debugging, the execution of the statement produces no output and simply returns false.
include 'adodb.inc.php';
$conn = newAdoConnection('mysqli');
$conn->connect($host, $user, $pass, 'database');
$conn->debug = true;
$recordSet = $conn->execute('SELECT * FROM product');
The information returned on STDOUT is:
------------------------------------------------------------------------------
mysqli: SELECT * FROM product
------------------------------------------------------------------------------
Query: select * from product failed. Table 'database.product' doesn't exist
1146: Table 'database.product' doesn't exist

Call stack (most recent call first):
 2. ADOConnection::_Execute(SELECT * FROM product) in .../drivers/adodb-mysqli.inc.php line 1091
 1. ADODB_mysqli::execute(SELECT * FROM product) in .../test.php line 36
By default, the parameters passed to the query are compressed into a set of key ⇒ value pairs.
This information is printed after the SQL statement, using a <code> tag. Styling can be applied using CSS, see Formatting section below.
Formatting
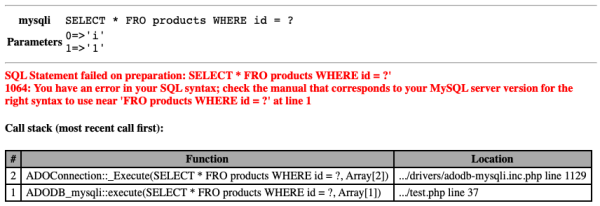
Starting with ADOdb 5.23.0, debug output is printed with HTML markup and styled with CSS classes. This can be leveraged to improve display of various elements. The output's structure is as follows:
- Wrapper
divwith adodb-debug class- SQL statement
divwith adodb-debug-sql class- Table with 2 columns (column 1 has
thheaders)- Row 1 with the query in a
codeblock - Optional row 2 with the parameters in a
codeblock, printed only there are any
- Error message
divif query execution failed, with adodb-debug-errmsg class - Code execution backtrace
divwith adodb-debug-trace class
Here is how the output looks like with the basic stylesheet below
.adodb-debug-sql code {
    font-size: large;
}
.adodb-debug-errmsg {
    font-weight: bold;
    color: red;
}
.adodb-debug-trace table {
    border-spacing: 0;
    border: 1px solid;
}
.adodb-debug-trace thead {
    background-color: darkgray;
}
.adodb-debug-trace th, .adodb-debug-trace td {
    border: 1px solid;
    padding: 2px 6px;
}
Special Options
There are 3 non-boolean switches that, if set, will vary some of the output produced
| Value | Description |
|---|---|
| 99 | If set, then the results of a debug_backtrace will be appended to every database execution, even if the execution is successful |
| -1 | If set, and the code is being run in a browser, then the line separators around the statement are suppressed. This option has no effect when the code is run in a CLI environment. |
| -99 | If set, then the SQL statement print is suppressed if the execution succeeds, reducing the amount of output to STDOUT |
Limitations
- Historically, the output messages were coded to be sent to a web page and some contain formatting that may make the messages more difficult to read.
- Some drivers, the SQL server driver in particular, produce overwhelming volumes of debugging information.

